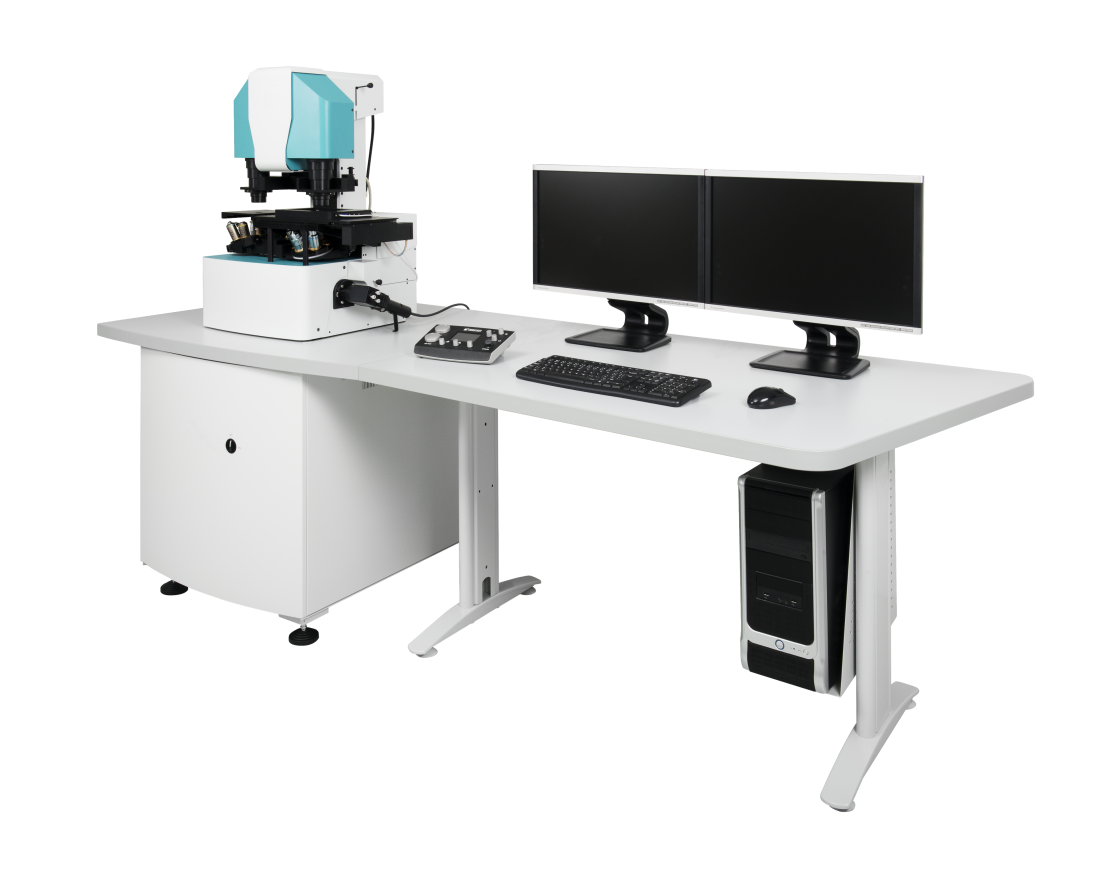
Q-PHASE: Quantitative label-free imaging cytometry
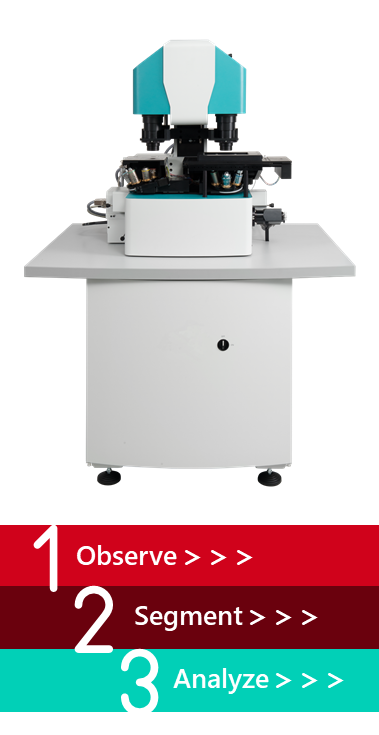
OBSERVE cells with unique QPI technology
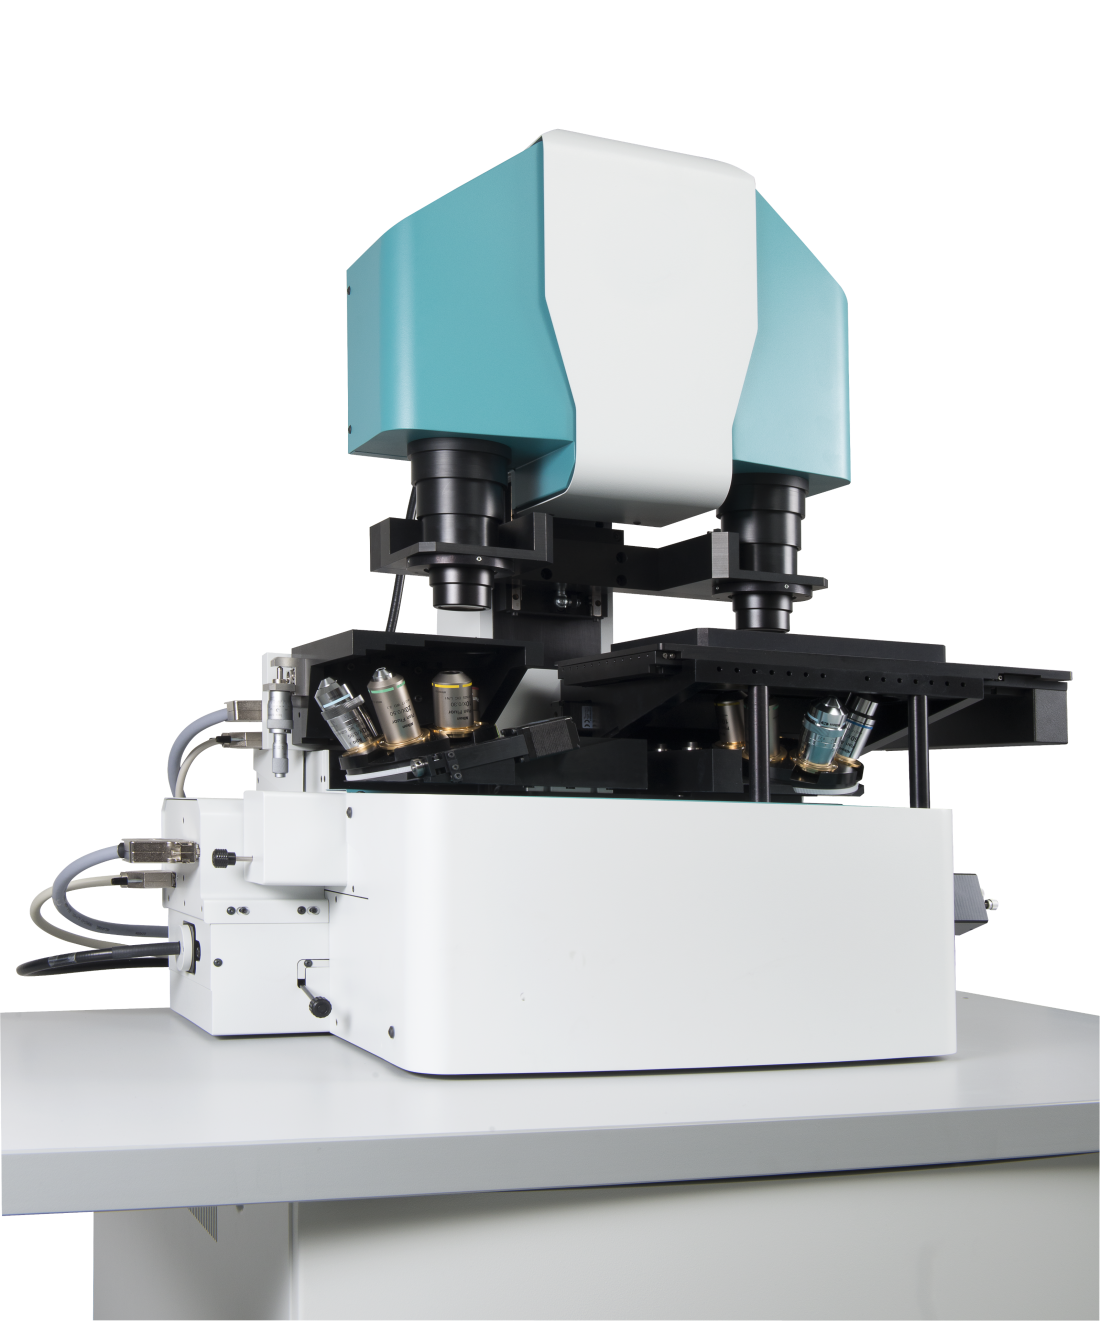
Quantitative phase imaging (QPI) is a novel label-free imaging technique bringing a completely new contrast into the live cell imaging field. It allows extracting information-rich quantitative data from unlabelled cells. It is directly proportional to the cellular dry mass and can be used for monitoring and direct quantification of dry mass changes inside the cells in pg/μm2. Thanks to the high sensitivity, even the slightest mass changes can be detected and quantified. Q-PHASE uses a patented technology of coherence-controlled holographic microscopy to provide QPI of the highest quality. Additional imaging modalities are available such as widefield fluorescence, simulated DIC, brightfield or high-pass filtered QPI. Multiple dimensions can be combined in a single experiment and automatically acquired by the Q-PHASE system (timelapse, multi-position, multi-channel, Z-stack). The system is optimized for long-term several-day experiments with living cells.
")
 (QPI, 10x obj.)")
")
")
")
")
")
")
 cells (QPI, 10x obj.)")
")
")
")
")
")
Unique cellular contrast
The quantitative phase imaging directly visualizes cellular mass (thickness × refractive index).
Transparent cells made visible
Even the most transparent cells and their parts can be distinguished from the background.
Look inside the cells
Changes in internal parts of cells such as nuclei, vacuoles, and many more, can be seen without any labelling.
Multiple imaging modes
Additional modalities can be collected simultaneously to provide a more complete picture in a synergistic fashion.
Automatically SEGMENT the data with high accuracy
QPI images offer the highest cell/background contrast among other label-free imaging techniques thus enabling the most reliable and precise automatic segmentation of individual cells. Even highly confluent populations can be reliably segmented. Moreover, fluorescence data can be utilized to refine the segmentation even further. QPI-based segmentation is also very fast, which significantly speeds up analyses of large datasets with thousands of frames.
")
")
")
ANALYZE quantitative data for every cell
The powerful Q-PHASE analysis toolbox processes segmented images on-the-fly and provides a complex portfolio of tools for data visualization, subpopulation gating and multi-parameter data mining. It links quantitative data to images and individual cells, which makes optimizing gates and checking outliers extremely easy and efficient. Resulting data can be exported in common file formats for further processing and analysis.


Key features
- Simple automated image segmentation and processing – reliable and fast, comparable to fluorescence data processing
- No image artifacts such as halo effect (as opposed to techniques based on Zernike phase contrast illumination)
- Very precise detection of cell boundaries
- Label-free – no staining is needed, simple sample preparation, observation of live cells in their native environment, no photobleaching problems
- Low phototoxicity – low light power density (107 × lower than fluorescence microscopy) allows long-term observations (for days)
- Coherence-gating effect – Q-PHASE special feature enabling to observe samples even in scattering media (phospholipid emulsions, extracellular matrices, etc.)
- Multimodality – fully integrated fluorescence module, simulated DIC, brightfield and high-pass filtered QPI
- High-quality QPI – Q-PHASE’s unique optical setup allows using incoherent illumination which provides extraordinary imaging quality without any compromises
- Strong suppression of coherent noise (speckles) & parasitic interferences (as opposed to laser-based approaches)
- Lateral resolution of conventional microscopes (up to 2× better when compared to common laser-based approaches or pinhole spatial filtering based techniques)
- Fast acquisition – the use of off-axis holographic approach makes Q-PHASE a single-shot instrument, thus enabling imaging of very fast cell dynamics
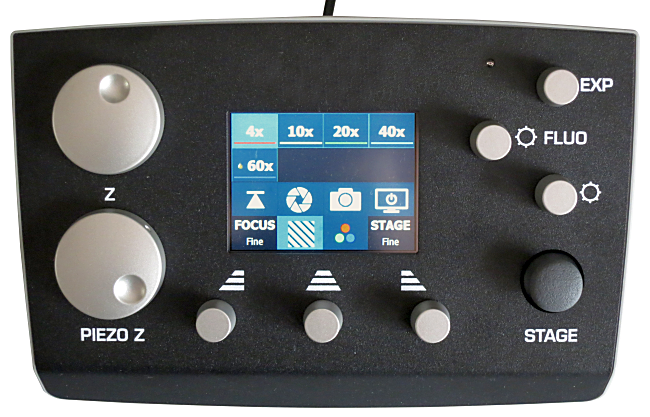
- Full motorization – focusing, sample stage, objective exchange, fluorescence filters
- Automated multidimensional acquisition – time-lapse, channel, position, Z-stack
- Quantitative – phase values can be recalculated e.g. to cell dry-mass density (pg/μm2) or direct topography with nanometer sensitivity (typically non-biological samples with homogeneous refractive index distribution)
- High phase detection sensitivity – enables to detect even the smallest changes in axial direction, very sensitive detection of morphology or position changes


Product brochure
Q-PHASE Brochure
Q-PHASE - MULTIMODAL HOLOGRAPHIC MICROSCOPE - Quantitative phase imaging. Download the brochure!
PDF –
7.9 MB
Publications
Patrick M. McCall, et al.: Quantitative phase microscopy enables precise and efficient determination of biomolecular condensate composition. PDF
J. T. Sheridan, et al.: Roadmap on holography. 2020 J. Opt. 22 123002.
L. Eyer, et al.: Broad-Spectrum Antiviral Activity of 3’-Deoxy-3’-Fluoroadenosine against Emerging Flaviviruses. American Society for Microbiology Journals, November 2020.
M. Fojtů, et al.: 2D Germanane Derivative as a Vector for Overcoming Doxorubicin Resistance in Cancer Cells. Applied Materials Today, Volume 20, September 2020, 100697.
M. Štefančík, et al.: Ni and TiO2 nanoparticles cause adhesion and cytoskeletal changes in human osteoblasts. Springer, 27 September 2020.
O. Ramaniuk, et al.: Quantitative Phase Imaging of Spreading Fibroblasts Identifies the Role of Focal Adhesion Kinase in the Stabilization of the Cell Rear. Biomolecules 10(8), 2020. PDF
M. Feith, et al.: Quantitative Phase Dynamics of Cancer Cell Populations Affected by Blue Light. Applied Sciences 10(7), 2020. PDF
T. Vicar, et al.: The Quantitative-Phase Dynamics of Apoptosis and Lytic Cell Death. Scientific Reports 10(1566), 2020. PDF
T. Vicar, et al.: Cell segmentation methods for label-free contrast microscopy: review and comprehensive comparison, BMC Bioinformatics 20(1), 2019. PDF
M. Raudenska, et al.: Cisplatin enhances cell stiffness and decreases invasiveness rate in prostate cancer cells by actin accumulation, Scientific Reports 9(1660), 2019. PDF
M. Fojtu, et al.: Black phosphorus cytotoxicity assessments pitfalls: Advantages and disadvantages of metabolic and morphological assays, Chemistry - A European Journal 25(1), 2019. PDF
A. , et al.: Direct phase mapping of broadband Laguerre-Gaussian metasurfaces, APL Photonics 3(11), 2018. PDF
O. Tolde, et al.: Quantitative phase imaging unravels new insight into dynamics of mesenchymal and amoeboid cancer cell invasion, Scientific Reports 8(12020), 2018. PDF
S. Dostalova, et al.: Prostate-Specific Membrane Antigen-Targeted Site-Directed Antibody-Conjugated Apoferritin Nanovehicle Favorably Influences In Vivo Side Effects of Doxorubicin, Scientific Reports 8(8867), 2018. PDF
S. Salucci, et al.: Marine bisindole alkaloid: A potential apoptotic inducer in human cancer cells, European Journal of Histochemistry 62(2), 2018. PDF
L. Pastorek, et al.: Holography microscopy as an artifact-free alternative to phase-contrast, Histochem Cell Biol. 149(2), 2018.
B. Gal, et al.: Distinctive behaviour of live biopsy-derived carcinoma cells unveiled using coherence-controlled holographic microscopy, PLoS One 12(8), 2017. PDF
L. Strbkova, et al.: Automated classification of cell morphology by coherence-controlled holographic microscopy, J. Biomed. Opt. 22(8), 2017. PDF
J. Babocky, et al.: Quantitative 3D Phase Imaging of Plasmonic Metasurfaces, ACS Photonics 4(6), 2017.
J. Zemanova, et al.: Chk1 inhibition significantly potentiates activity of nucleoside analogs in TP53-mutated B-lymphoid cells, Oncotarget 7(38), 2016. PDF
L. Strbkova, et al.: The adhesion of normal human dermal fibroblasts to the cyclopropylamine plasma polymers studied by holographic microscopy, Surface and Coatings Technology 295, 2016. PDF
J. Balvan, et al.: Oxidative Stress Resistance in Metastatic Prostate Cancer: Renewal by Self-Eating, PLoS One 10(12), 2015. PDF
J. Collakova, et al.: Coherence-controlled holographic microscopy enabled recognition of necrosis as the mechanism of cancer cells death after exposure to cytopathic turbid emulsion, J. Biomed. Opt. 20(11), 2015. PDF
V. Kollarova, et al.: Quantitative phase imaging through scattering media by means of coherence-controlled holographic microscope, J. Biomed. Opt. 20(11), 2015. PDF
A. Krizova, et al.: Dynamic phase differences based on quantitative phase imaging for the objective evaluation of cell behavior, J. Biomed. Opt. 20(11), 2015.
J. Balvan, et al.: Multimodal Holographic Microscopy: Distinction between Apoptosis and Oncosis, PloS One 10(3), 2015. PDF
M. Lostak, et al.: Coherence-controlled holographic microscopy in diffuse media, Opt. Express 22(4), 2014. PDF
T. Slaby, et al.: Off-axis setup taking full advantage of incoherent illumination in coherence-controlled holographic microscope, Opt. Express 21(12), 2013. PDF
H. Janeckova, et al.: Proving Tumour Cells by Acute Nutritional/Energy Deprivation as a Survival Threat: A Task for Microscopy, Anticancer Res. 29(6), 2009. PDF